Metrics
Dated snapshots of the numbers behind your work: stars, forks, downloads, citations and anything else your connectors measure.
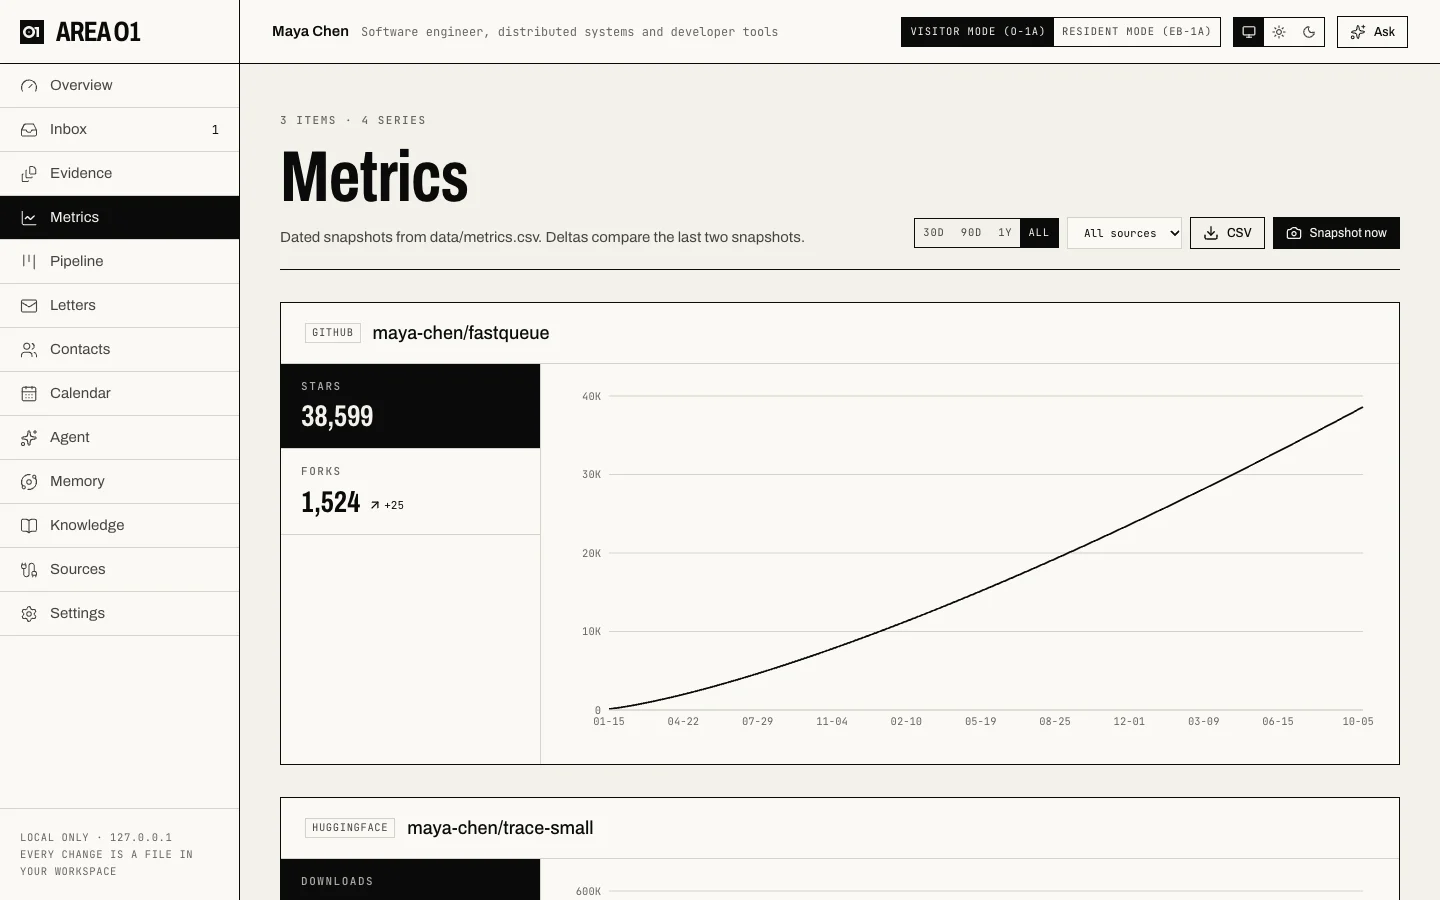
What's on it
- One card per tracked item (a repo, a model, an author profile) with its latest values and the change since the previous snapshot, and a trend chart.
- 30D / 90D / 1Y / All sets the chart range; All sources filters by connector.
- CSV downloads
data/metrics.csv; Snapshot now records today's numbers.
Where the numbers come from
Every snapshot is a row in data/metrics.csv (date, source, item, metric, value), and each value is also a
claim that quotes the API response it came from. The metrics-snapshot job adds a row every other Monday;
GitHub's traffic numbers (views, clones) only cover the last 14 days, so regular snapshots are how you keep
that history.
Growth over time is often stronger evidence than a single number. Keep snapshotting even when nothing seems to change. See Evidence that holds up.